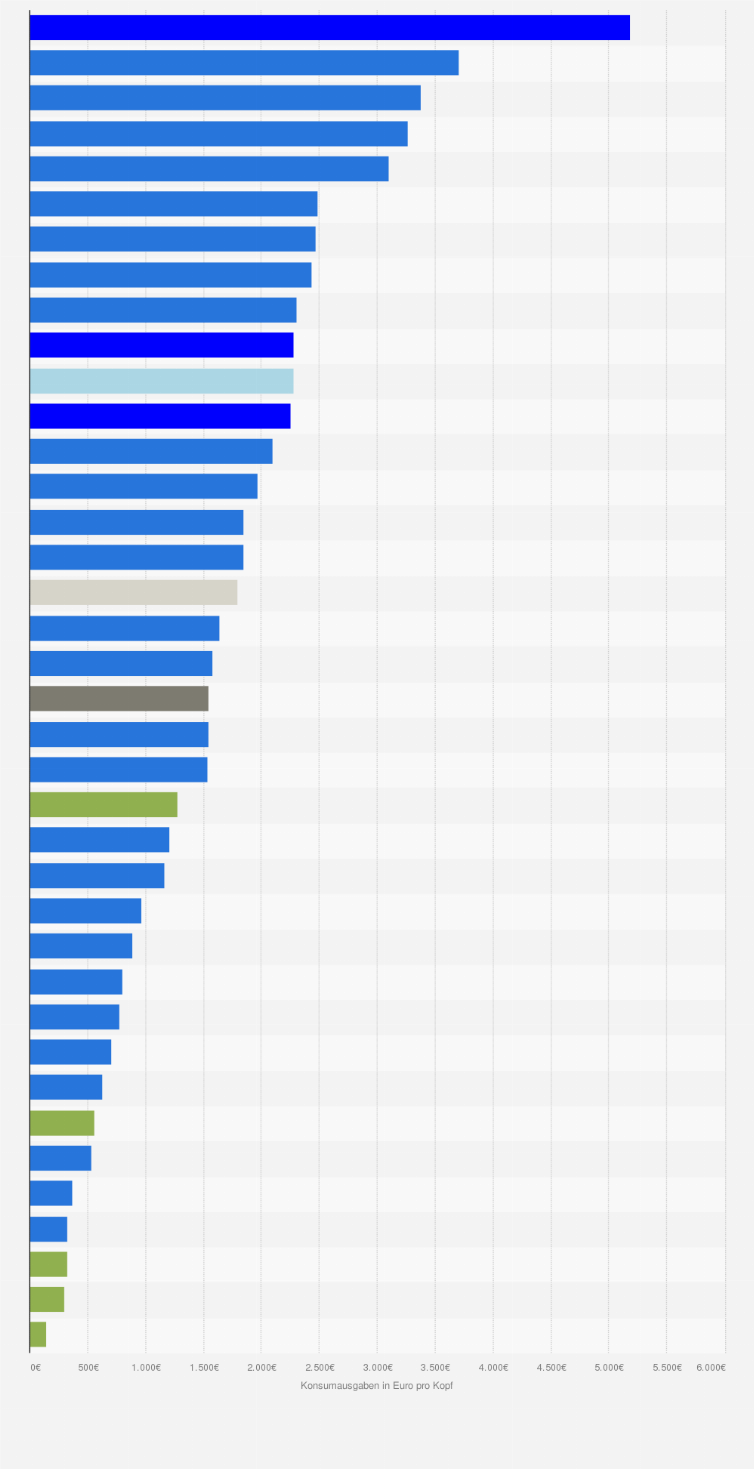
Pro Kopf Konsumausgaben in den EU-Ländern für Restaurants und Hotels 2022
Die Konsumausgaben der privaten Haushalte in der Europäischen Union¹ ² ³ (EU-27) für Restaurants und Hotels betragen im Jahr 2022 im Durchschnitt rund
Melden Sie sich an oder registrieren Sie sich, um auf präzise Daten zuzugreifen.
Melden Sie sich an oder registrieren Sie sich, um auf präzise Daten zuzugreifen.
Melden Sie sich an oder registrieren Sie sich, um auf präzise Daten zuzugreifen.
Was sind Konsumausgaben der privaten Haushalte ?
Unter den Konsumausgaben der privaten Haushalte werden alle unmittelbaren Ausgaben von Privatpersonen eines Haushalts in Waren und Dienstleistungen verstanden. Konsum ist der Verbrauch von Einkommen. Das Gegenteil ist Sparen, also das Einbehalten von Einkommen (Konsumverzicht) für einen zukünftigen Verbrauch. Das Gegenstück zu den Konsumausgaben der privaten Haushalte ist die Sparquote der privaten Haushalte. Allgemein geben die privaten Haushalte bei optimistischer Stimmung einen größeren Anteil ihres Einkommens aus, sie konsumieren. Ist die Stimmung eher negativ, z.B. in einer allgemeinen Wirtschaftskrise, behalten die privaten Haushalte einen größeren Anteil ihres Einkommens aus Sorge, z.B. vor Arbeitslosigkeit, ein, sie sparen das Einkommen.
Daher sind Konsumentenbefragungen, die die Konsumlaune oder Konsumstimmung der Verbraucher einfangen, ein wichtiger Konjunkturindikator. Konsumentenbefragungen ermöglichen einen Blick in die zukünftige Entwicklung der Binnennachfrage.
Wofür geben die privaten Haushalte ihr Einkommen aus?
Der Blick auf die Konsumausgaben der privaten Haushalte informiert zunächst darüber ob die Konsumlaune der Verbraucher günstig oder ungünstig war. Aber erst der Blick auf die Konsumausgaben der privaten Haushalte nach Verwendungszweck informiert darüber, wofür die Bürger.innen ihr Einkommen ausgeben. Allgemein werden die Konsumausgaben daher nach Art der Verwendung unterschieden. Üblicherweise werden folgende Verwendungszwecke unterschieden:
- Nahrungsmittel und alkoholfreie Getränke
- Alkoholische Getränke, Tabak und Narkotikum
- Bekleidung und Schuhe
- Wohnung, Wasser, Elektrizität, Gas und andere Brennstoffe
- Hausrat und laufende Instandhaltung des Hauses
- Gesundheit
- Verkehr
- Nachrichtenübermittlung
- Freizeit und Kultur
- Bildungswesen
- Restaurants und Hotels
- Verschiedene Waren und Dienstleistungen