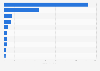
Bitte beachten Sie, dass die von Ihnen aufgerufene Seite nicht in Ihrer Standardsprache vorliegt. Sie nutzen unsere Plattform nun in einer anderen Sprache.
This statistic shows the brands of shelf-to-microwave oven (not refrigerated) dinners, entrees and soups used in the United States from 2012 to 2020. The data has been calculated by Statista based on the U.S. Census data and Simmons National Consumer Survey (NHCS). According to this statistic, 14.66 million Americans used Chef boyardee microwave in 2020.
U.S. population: Brands of shelf-to-microwave oven (not refrigerated) dinners, entrees and soups from 2012 to 2020
Basic Account
Get to know the platform
You only have access to basic statistics.
This statistic is not included in your account.
Starter Account
The ideal entry-level account for individual users
- Instant access to 1m statistics
- Download in XLS, PDF & PNG format
- Detailed references
$199 USD / Month *
Professional Account
Full access
Business Solutions including all features.
* Prices do not include sales tax.
Other statistics that may interest you Statistics on
About the industry
10
- Premium Statistic Amount of shelf-to-microwave dishes eaten in the U.S. 2011-2020
- Premium Statistic Consumption of shelf-to-microwave oven dishes in the U.S. 2011-2024
- Premium Statistic Usage of pizza crust (ready-made) in the U.S. 2011-2024
- Premium Statistic Brands of pizza crust (ready-made) used in the U.S. 2011-2020
- Premium Statistic Amount of complete prepared dishes and dinners eaten in the U.S. 2012-2020
- Premium Statistic Usage of packaged instant potatoes in the U.S. 2011-2024
- Premium Statistic Kinds of refrigerated or frozen dough in the U.S. 2011-2020
- Premium Statistic Brands of refrigerated or frozen dough in the U.S. 2012-2020
- Premium Statistic Amount of refrigerated dough used within 30 days in the U.S. 2011-2020
- Premium Statistic Usage of refrigerated or frozen dough in the U.S. 2011-2024
About the region
10
- Premium Statistic Types of nuts for cooking and snacks used in the U.S. 2011-2020
- Premium Statistic Amount of packaged instant potatoes used within 30 days in the U.S. 2011-2020
- Premium Statistic Brands of rice / rice dishes eaten in the U.S. 2013-2020
- Premium Statistic Kinds of nuts for cooking and snacks most used in the U.S. 2011-2020
- Premium Statistic Consumption of packaged muffins (ready-to-eat) in the U.S. 2011-2024
- Premium Statistic Amount of pork / beans or baked beans used in the U.S. 2011-2020
- Premium Statistic Purposes for the usage of nuts in the U.S. 2011-2020
- Premium Statistic Kinds of rice / rice dishes consumed in the U.S. 2011-2020
- Premium Statistic Usage of jarred / canned pork and beans / baked beans in the U.S. 2011-2024
- Premium Statistic Types of organic foods used in the U.S. 2011-2020
Selected statistics
1
Other regions
9
- Premium Statistic Microwave equipment in French households 2017, by age
- Premium Statistic Leading brands of fresh soup in Great Britain 2013-2020, by number of users
- Premium Statistic Consumption frequency of home-cooked meals in the Netherlands 2017
- Basic Statistic Share of people owning microwave ovens in Germany 2008-2017
- Premium Statistic Canadians who don't have time to make or eat meals at home by region 2017
- Basic Statistic Survey on popular main dishes in Sweden 2022
- Premium Statistic Per capita consumption of yoghurts in Spain 2020, by type
- Basic Statistic Share of people owning microwave ovens in Ireland 2003-2017
- Basic Statistic Time spent cooking a weeknight meal in China 2019, by duration
Related statistics
10
- Premium Statistic Amount of peanut butter eaten within 30 days in the U.S. 2011-2020
- Premium Statistic Servings of rice / rice dishes eaten within 7 days in the U.S. 2011-2020
- Premium Statistic Brands of packaged muffins (ready-to-eat) consumed in the U.S. 2011-2020
- Premium Statistic Consumption of peanut butter in the U.S. 2012-2024
- Premium Statistic Usage of nuts for cooking and snacks in the U.S. 2011-2024
- Premium Statistic Types of peanut butter eaten in the U.S. 2011-2020
- Premium Statistic Brands of pickles consumed in the U.S. 2011-2020
- Premium Statistic Usage of organic foods in the U.S. 2011-2024
- Premium Statistic Types of packaged instant potatoes used in the U.S. 2011-2020
- Premium Statistic Brands of prepared lunch kits used in the U.S. 2012-2020
Further related statistics
10
- Number of TV households in the UK 2010-2019, by platform
- Daily U.S. water withdrawals by category 2015
- U.S. Usage frequency of modern sporting rifles in the last 12 months 2010
- Coal consumption in South Africa 1998-2022
- Sales of Nestlé in AOA 2021-2023, by product categories
- Sales of Nestlé in Zone North America (NA) from 2021-2023, by product categories
- Import volume of cobalt in the U.S. 2010-2023
- Number of TV households in the UK 2013-2022
- Minutes per day spent watching broadcast TV in the UK 2010-2022, by age
- Coal consumption volume in China 1998-2022
Further Content: You might find this interesting as well
Statistics
- Number of TV households in the UK 2010-2019, by platform
- Daily U.S. water withdrawals by category 2015
- U.S. Usage frequency of modern sporting rifles in the last 12 months 2010
- Coal consumption in South Africa 1998-2022
- Sales of Nestlé in AOA 2021-2023, by product categories
- Sales of Nestlé in Zone North America (NA) from 2021-2023, by product categories
- Import volume of cobalt in the U.S. 2010-2023
- Number of TV households in the UK 2013-2022
- Minutes per day spent watching broadcast TV in the UK 2010-2022, by age
- Coal consumption volume in China 1998-2022
Statista. (November 1, 2020). U.S. population: Brands of shelf-to-microwave oven (not refrigerated) dinners, entrees and soups from 2012 to 2020 [Graph]. In Statista. Retrieved May 09, 2024, from https://www.statista.com/statistics/283247/us-households-brands-of-shelf-to-microwave-dinners-entrees-and-soups-trend/
Statista. "U.S. population: Brands of shelf-to-microwave oven (not refrigerated) dinners, entrees and soups from 2012 to 2020." Chart. November 1, 2020. Statista. Accessed May 09, 2024. https://www.statista.com/statistics/283247/us-households-brands-of-shelf-to-microwave-dinners-entrees-and-soups-trend/
Statista. (2020). U.S. population: Brands of shelf-to-microwave oven (not refrigerated) dinners, entrees and soups from 2012 to 2020. Statista. Statista Inc.. Accessed: May 09, 2024. https://www.statista.com/statistics/283247/us-households-brands-of-shelf-to-microwave-dinners-entrees-and-soups-trend/
Statista. "U.S. Population: Brands of Shelf-to-microwave Oven (Not Refrigerated) Dinners, Entrees and Soups from 2012 to 2020." Statista, Statista Inc., 1 Nov 2020, https://www.statista.com/statistics/283247/us-households-brands-of-shelf-to-microwave-dinners-entrees-and-soups-trend/
Statista, U.S. population: Brands of shelf-to-microwave oven (not refrigerated) dinners, entrees and soups from 2012 to 2020 Statista, https://www.statista.com/statistics/283247/us-households-brands-of-shelf-to-microwave-dinners-entrees-and-soups-trend/ (last visited May 09, 2024)
U.S. population: Brands of shelf-to-microwave oven (not refrigerated) dinners, entrees and soups from 2012 to 2020 [Graph], Statista, November 1, 2020. [Online]. Available: https://www.statista.com/statistics/283247/us-households-brands-of-shelf-to-microwave-dinners-entrees-and-soups-trend/