Bitte beachten Sie, dass die von Ihnen aufgerufene Seite nicht in Ihrer Standardsprache vorliegt. Sie nutzen unsere Plattform nun in einer anderen Sprache.
Operating income attributable to GM's Cruise business between 1st quarter 2018 and 4th quarter 2023 (in million U.S. dollars)
Basic Account
Get to know the platform
You only have access to basic statistics.
This statistic is not included in your account.
Starter Account
The ideal entry-level account for individual users
- Instant access to 1m statistics
- Download in XLS, PDF & PNG format
- Detailed references
$199 USD / Month *
Professional Account
Full access
Business Solutions including all features.
* Prices do not include sales tax.
Other statistics that may interest you General Motors Company
Overview
5
- Premium Statistic Annual car sales worldwide 2010-2023, with a forecast for 2024
- Premium Statistic International automobile sales by region 2018-2024
- Premium Statistic Revenue of leading carmakers worldwide 2022
- Basic Statistic General Motors Company: number of vehicles sold worldwide 2010-2023
- Basic Statistic General Motors Company: number of employees 2010-2023
Financials
4
- Basic Statistic General Motors Company: revenue 2013-2023
- Basic Statistic General Motors Company: adjusted EBIT 2016-2023
- Basic Statistic General Motors Company: research and development expenditures 2015-2023
- Premium Statistic General Motors Company: net income attributable to common stockholders 2019-2023
Segments
7
- Premium Statistic General Motors Company: revenue by region 2021 & 2023
- Premium Statistic SAIC-GM joint venture: revenue 2015-2022
- Premium Statistic 
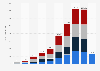
GM Cruise: operating income by quarter 2018-2023
- Premium Statistic General Motors Company: global vehicle sales by region 2022 -2023
- Premium Statistic General Motors Company: vehicle sales by country 2023
- Premium Statistic SAIC-General Motors joint venture car sales 2011-2023
- Premium Statistic General Motors Company: vehicle sales in the United States by brand Q4 2020-Q4 2023
Competitors
7
- Premium Statistic Car brand market share worldwide 2023
- Premium Statistic Ford Motor Company: total revenue 2008-2023
- Premium Statistic Wholesale vehicle sales of the Ford Motor Company 2009-2023
- Premium Statistic Net revenue of Stellantis 2019-2023
- Premium Statistic Regional sales of Stellantis 2019-2023
- Basic Statistic Tesla's revenue 2008-2023
- Basic Statistic Tesla's vehicle sales by quarter YTD Q1 2024
Special focus on the U.S. market
6
- Basic Statistic United States: light vehicle sales by manufacturer YTD 2022-2023
- Premium Statistic Car manufacturers' U.S. market share YTD 2023
- Premium Statistic U.S.: best-selling car brands 2023
- Basic Statistic U.S. vehicle sales of North American car brands Q4 2022 & Q4 2023
- Basic Statistic U.S.: best-selling pickup trucks 2023
- Premium Statistic Best-selling battery-electric cars in the United States 2023
Further related statistics
20
- U.S. adults going on a cruise during summer as of May 2021
- Hyundai Mobis estimated sales value 2018-2025
- Expected lifecycle of autonomous vehicles 2030
- Garmin automotive segment revenue worldwide 2008-2022
- Market estimates for lithium-ion battery use in PHEVs 2012-2020
- Daily mileage by day of the week - U. S. vehicle driver survey 2015
- Usage of car navigators in Italy 2016
- eHailing - worldwide network of vehicles 2025
- American adults' attitude towards automation 2017
- Electric vehicle charger number in South Korea 2011-2015
- Automated driving systems expected usage Japan 2017
- Breakdown of technology and innovation scores for AVs in Singapore 2020
- Mexico: preparedness for autonomous vehicles 2020, by category
- Autonomous driving projected revenue in China 2016-2021
- Autonomous driving - projected revenue in U.S. 2016-2021
- Autonomous driving level 4 - projected revenue by major market 2030
- V2X: global market size by segment 2030
- Autonomous driving - projected revenue in Japan 2016-2021
- Autonomous driving market size in China 2014-2018
- Industry revenue of “Manufacturing of reinforced and non-reinforced plastic containers for packaging“ in Mexico 2012-2024
Further Content: You might find this interesting as well
Statistics
- U.S. adults going on a cruise during summer as of May 2021
- Hyundai Mobis estimated sales value 2018-2025
- Expected lifecycle of autonomous vehicles 2030
- Garmin automotive segment revenue worldwide 2008-2022
- Market estimates for lithium-ion battery use in PHEVs 2012-2020
- Daily mileage by day of the week - U. S. vehicle driver survey 2015
- Usage of car navigators in Italy 2016
- eHailing - worldwide network of vehicles 2025
- American adults' attitude towards automation 2017
- Electric vehicle charger number in South Korea 2011-2015
- Automated driving systems expected usage Japan 2017
- Breakdown of technology and innovation scores for AVs in Singapore 2020
- Mexico: preparedness for autonomous vehicles 2020, by category
- Autonomous driving projected revenue in China 2016-2021
- Autonomous driving - projected revenue in U.S. 2016-2021
- Autonomous driving level 4 - projected revenue by major market 2030
- V2X: global market size by segment 2030
- Autonomous driving - projected revenue in Japan 2016-2021
- Autonomous driving market size in China 2014-2018
- Industry revenue of “Manufacturing of reinforced and non-reinforced plastic containers for...
General Motors. (January 30, 2024). Operating income attributable to GM's Cruise business between 1st quarter 2018 and 4th quarter 2023 (in million U.S. dollars) [Graph]. In Statista. Retrieved May 21, 2024, from https://www.statista.com/statistics/1077077/gm-cruise-operating-income/
General Motors. "Operating income attributable to GM's Cruise business between 1st quarter 2018 and 4th quarter 2023 (in million U.S. dollars)." Chart. January 30, 2024. Statista. Accessed May 21, 2024. https://www.statista.com/statistics/1077077/gm-cruise-operating-income/
General Motors. (2024). Operating income attributable to GM's Cruise business between 1st quarter 2018 and 4th quarter 2023 (in million U.S. dollars). Statista. Statista Inc.. Accessed: May 21, 2024. https://www.statista.com/statistics/1077077/gm-cruise-operating-income/
General Motors. "Operating Income Attributable to Gm's Cruise Business between 1st Quarter 2018 and 4th Quarter 2023 (in Million U.S. Dollars)." Statista, Statista Inc., 30 Jan 2024, https://www.statista.com/statistics/1077077/gm-cruise-operating-income/
General Motors, Operating income attributable to GM's Cruise business between 1st quarter 2018 and 4th quarter 2023 (in million U.S. dollars) Statista, https://www.statista.com/statistics/1077077/gm-cruise-operating-income/ (last visited May 21, 2024)
Operating income attributable to GM's Cruise business between 1st quarter 2018 and 4th quarter 2023 (in million U.S. dollars) [Graph], General Motors, January 30, 2024. [Online]. Available: https://www.statista.com/statistics/1077077/gm-cruise-operating-income/