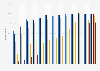
Bitte beachten Sie, dass die von Ihnen aufgerufene Seite nicht in Ihrer Standardsprache vorliegt. Sie nutzen unsere Plattform nun in einer anderen Sprache.
This statistic presents the distribution of preferred mobile payment providers among surveyed Millennials* in the United Kingdom, Germany, the Netherlands and Italy, as of November 2016. Among Millennials in Italy and Germany, Paypal was the preferred provider, with 62 percent of responding Italians and 54 percent of responding Germans likely to use the mobile service provided by Paypal. In contrast to the preferences of Germany and Italians, 58 percent of responding British Millennials and 53 percent of their Dutch peers were likely to use mobile payments provided by their bank.
Provider preferences for mobile payments among Millennials* in selected European countries as of 2016
Basic Account
Get to know the platform
You only have access to basic statistics.
This statistic is not included in your account.
Starter Account
The ideal entry-level account for individual users
- Instant access to 1m statistics
- Download in XLS, PDF & PNG format
- Detailed references
$199 USD / Month *
Professional Account
Full access
Business Solutions including all features.
* Prices do not include sales tax.
Other statistics that may interest you Statistics on
About the industry
10
- Premium Statistic QR code payment value at stores in Japan 2018-2023
- Premium Statistic Number of monthly active users of QR code payment services in Japan 2020-2023
- Premium Statistic Preferred online payment methods in Finland 2021
- Premium Statistic Leading mobile payment providers in South Korea 2023
- Premium Statistic Share of MobilePay users in Denmark 2022, by age groups
- Premium Statistic Situations for using mobile payment services in South Korea 2019
- Premium Statistic Reasons for using Samsung Pay in South Korea 2019
- Premium Statistic Reasons for using Naver Pay in South Korea 2019
- Premium Statistic Reasons for using KakaoPay in South Korea 2019
- Premium Statistic Mobile payment provider brand awareness in South Korea 2019
About the region
10
- Basic Statistic Number of cashless payments in Germany 2013-2020, by type
- Premium Statistic Number of credit institutions and bank branches in Germany 2018
- Basic Statistic Age distribution of N26 customers in Germany 2017
- Basic Statistic Key figures of German bank N26 2017
- Premium Statistic Mobile payment providers: trust levels in Germany in 2012 and 2014
- Premium Statistic Private equity investment manager salary per annum in Germany 2017-2023
- Premium Statistic Risk manager in banking salary in Germany 2023, by years of experience
- Premium Statistic Revenue of the IT outsourcing industry in Germany 2020-2029
- Premium Statistic Payments at points of sale by type in Germany 2024
- Premium Statistic Biggest contactless payment brands at POS in Germany 2024
Other regions
9
- Premium Statistic Use of online payment platforms in last year Australia 2018 by age
- Premium Statistic Europe: consumer confidence in contactless payments 2014
- Basic Statistic Average carrier billing transaction value in Finland 2019-2021
- Basic Statistic U.S. consumers who chose a restaurant due to order ahead availability 2017, by age
- Premium Statistic Most used payment methods in France 2019
- Premium Statistic PayPal annual net revenue 2012-2020
- Basic Statistic Average carrier billing transaction value in Norway 2019-2021
- Premium Statistic Major mobile payment expenditures in China 2020, by category
- Basic Statistic Average carrier billing transaction value in Denmark 2019-2021
Related statistics
10
- Premium Statistic Mobile peer-to-peer payments frequency in the UK 2016
- Premium Statistic Number of customers at selected European fintech companies 2018
- Premium Statistic Awareness of the new EU directive on online banking in Italy 2019
- Premium Statistic Opinion on the new EU Directive on online banking in Italy 2019
- Premium Statistic Advantages of the new EU directive on online banking in Italy 2019
- Premium Statistic Security of OTP tokens and smartphones to access online banking in Italy 2019
- Premium Statistic Number of banking app users in the United States as of 2011
- Premium Statistic Total assets of the largest banks in the UK 2012-2023
- Premium Statistic Number of customers at selected digital banks in Europe 2023
- Basic Statistic Tier 1 capital ratio at Deutsche Bank 2009-2023
Further related statistics
10
- Senior chief financial officer salary per annum in Switzerland 2023
- Total assets of the Industrial and Commercial Bank of China 2012-2023
- Operating income of the Industrial and Commercial Bank of China 2013-2023
- Total assets of the Bank of Communications 2013-2023
- Operating income of the Bank of Communications 2013-2023
- Total assets of the China Construction Bank 2013-2023
- Return on average common shareholder equity at Goldman Sachs 2009-2023
- Employee compensation and benefits at Deutsche Bank 2006-2022
- Net revenue from investment banking at Goldman Sachs 2009-2023
- Total assets of Banco Santander 2001-2023
Further Content: You might find this interesting as well
Statistics
- Senior chief financial officer salary per annum in Switzerland 2023
- Total assets of the Industrial and Commercial Bank of China 2012-2023
- Operating income of the Industrial and Commercial Bank of China 2013-2023
- Total assets of the Bank of Communications 2013-2023
- Operating income of the Bank of Communications 2013-2023
- Total assets of the China Construction Bank 2013-2023
- Return on average common shareholder equity at Goldman Sachs 2009-2023
- Employee compensation and benefits at Deutsche Bank 2006-2022
- Net revenue from investment banking at Goldman Sachs 2009-2023
- Total assets of Banco Santander 2001-2023
VocaLink, & Ipsos. (November 30, 2016). Provider preferences for mobile payments among Millennials* in selected European countries as of 2016 [Graph]. In Statista. Retrieved May 21, 2024, from https://www.statista.com/statistics/727462/millennials-preferences-for-mobile-payment-provider-europe/
VocaLink, und Ipsos. "Provider preferences for mobile payments among Millennials* in selected European countries as of 2016." Chart. November 30, 2016. Statista. Accessed May 21, 2024. https://www.statista.com/statistics/727462/millennials-preferences-for-mobile-payment-provider-europe/
VocaLink, Ipsos. (2016). Provider preferences for mobile payments among Millennials* in selected European countries as of 2016. Statista. Statista Inc.. Accessed: May 21, 2024. https://www.statista.com/statistics/727462/millennials-preferences-for-mobile-payment-provider-europe/
VocaLink, and Ipsos. "Provider Preferences for Mobile Payments among Millennials* in Selected European Countries as of 2016." Statista, Statista Inc., 30 Nov 2016, https://www.statista.com/statistics/727462/millennials-preferences-for-mobile-payment-provider-europe/
VocaLink & Ipsos, Provider preferences for mobile payments among Millennials* in selected European countries as of 2016 Statista, https://www.statista.com/statistics/727462/millennials-preferences-for-mobile-payment-provider-europe/ (last visited May 21, 2024)
Provider preferences for mobile payments among Millennials* in selected European countries as of 2016 [Graph], VocaLink, & Ipsos, November 30, 2016. [Online]. Available: https://www.statista.com/statistics/727462/millennials-preferences-for-mobile-payment-provider-europe/