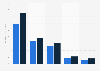
Market value of casual dining full-service restaurants in Hong Kong 2011-2015
This statistic depicts the food service value of casual dining full-service restaurants in Hong Kong from 2011 to 2015. In 2014, the total market value for casual dining full-service restaurants in Hong Kong had reached around 11 billion Hong Kong dollars.