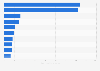
Bitte beachten Sie, dass die von Ihnen aufgerufene Seite nicht in Ihrer Standardsprache vorliegt. Sie nutzen unsere Plattform nun in einer anderen Sprache.
This statistic displays the volume of meetings in the United Kingdom (UK) in 2011, by host city. The majority of meetings was held in London, with 362.5 thousand meetings, followed by almost 47.4 thousand in Cardiff and 28.6 thousand in Edinburgh.
Number of meetings in the United Kingdom (UK) in 2011, by city (in 1,000)
Loading statistic...
Basic Account
Get to know the platform
You only have access to basic statistics.
Starter Account
The ideal entry-level account for individual users
- Instant access to 1m statistics
- Download in XLS, PDF & PNG format
- Detailed references
$199 USD / Month *
Professional Account
Full access
Business Solutions including all features.
* Prices do not include sales tax.
Other statistics that may interest you Statistics on
About the industry
10
- Premium Statistic Number of conventions held in Las Vegas 2001-2017
- Premium Statistic Predictions on the format of exhibitions worldwide 2022
- Basic Statistic Organiser spending for business events in the UK in 2011, by spending category
- Basic Statistic Tourism industry: survival rate of event companies in the UK 2008-2011
- Premium Statistic Event type distribution in Germany 2023
- Premium Statistic Number of events at the Swedish Exhibition & Congress Centre 2011-2022
- Premium Statistic Challenges of the global exhibition and trade show industry 2022
- Premium Statistic Most important issues facing the exhibition industry in Mexico 2024
- Premium Statistic Most important issues facing the exhibition industry in Central & South America 2024
- Basic Statistic Most important issues facing the exhibition industry in Europe 2021, by country
About the region
9
- Basic Statistic Value of the events sector in the United Kingdom (UK) 2017
- Basic Statistic Exhibitor operation spending for business events in the UK in 2011, by category
- Basic Statistic UK meeting industry: direct meeting GVA generated in the UK, by regions in England
- Premium Statistic Spending on business tourism visits to the UK 2019, by purpose
- Basic Statistic International business tourist visits to the UK 2019, by purpose
- Premium Statistic Business events organized by PCOs and event agencies in the UK 2008-2018
- Basic Statistic UK meeting industry: meeting organiser spending in the UK in 2011, by meeting type
- Basic Statistic Most popular wedding day England and Wales 2020
- Premium Statistic Business event spending in the UK 2014-2021
Selected statistics
1
Other regions
10
- Premium Statistic Self-produced events contribution in exhibition centers revenue in France 2011-2019
- Premium Statistic Digitization in exhibition industry in South & Central America 2019
- Premium Statistic Mexico: factors making a trade show entertaining 2019
- Basic Statistic Strategic activity priorities of the exhibition industry, by region 2020
- Premium Statistic Share of overnight business visitors in Hong Kong 2016-2019
- Basic Statistic Leading convention centers in Asia Pacific as of June 2017, by size
- Premium Statistic Number of cultural historical buildings in Norway 2019, by county
- Basic Statistic Leading convention centers in Canada as of June 2017, by size
- Premium Statistic Fairs and exhibitions in Italy 2019-2020
- Premium Statistic Largest U.S. convention centers 2021
Related statistics
10
- Basic Statistic Strategic location priorities of the exhibition industry worldwide 2020
- Premium Statistic Main factors considered when choosing business event venues in Europe 2021
- Premium Statistic International participants at business events in Germany 2010-2020
- Premium Statistic Number of trade shows and fairs in France 2019, by event type
- Premium Statistic COVID-19 impact on cancellation and postponement of B2B exhibitions in the U.S. 2020
- Premium Statistic Most offered digital content of B2B exhibitions during COVID-19 in the U.S. 2020
- Premium Statistic Share of congress delegates in Paris 2019, by type of venue
- Basic Statistic Number of sleeping rooms in the leading meeting destinations in Europe 2019
- Basic Statistic Number of meeting hotels in the leading meeting destinations in the U.S. 2018
- Basic Statistic Number of sleeping rooms in the leading meeting destinations in the U.S. 2019
Further related statistics
10
- Revenue share from tourism in India 2013-2022, by segment
- Quarterly average daily rate of hotels in Seattle 2016-2017
- Quarterly average daily rate of hotels in San Diego 2016-2017
- Quarterly average daily rate in hotels in Washington D.C. 2016-2017
- Quarterly average daily rate of hotels in Brussels 2010-2017
- Quarterly average daily rate of hotels in Atlanta 2016-2017
- Quarterly average daily rate of hotels in Houston 2016-2017
- Quarterly average daily rate of hotels in Indianapolis 2016-2017
- Quarterly average daily rate of hotels in New York 2016-2017
- Quarterly average daily rate of hotels in Philadelphia 2016-2017
Further Content: You might find this interesting as well
Statistics
- Revenue share from tourism in India 2013-2022, by segment
- Quarterly average daily rate of hotels in Seattle 2016-2017
- Quarterly average daily rate of hotels in San Diego 2016-2017
- Quarterly average daily rate in hotels in Washington D.C. 2016-2017
- Quarterly average daily rate of hotels in Brussels 2010-2017
- Quarterly average daily rate of hotels in Atlanta 2016-2017
- Quarterly average daily rate of hotels in Houston 2016-2017
- Quarterly average daily rate of hotels in Indianapolis 2016-2017
- Quarterly average daily rate of hotels in New York 2016-2017
- Quarterly average daily rate of hotels in Philadelphia 2016-2017
MPI Foundation. (July 10, 2013). Number of meetings in the United Kingdom (UK) in 2011, by city (in 1,000) [Graph]. In Statista. Retrieved May 23, 2024, from https://www.statista.com/statistics/298045/business-meeting-volume-in-the-united-kingdom-by-city/
MPI Foundation. "Number of meetings in the United Kingdom (UK) in 2011, by city (in 1,000)." Chart. July 10, 2013. Statista. Accessed May 23, 2024. https://www.statista.com/statistics/298045/business-meeting-volume-in-the-united-kingdom-by-city/
MPI Foundation. (2013). Number of meetings in the United Kingdom (UK) in 2011, by city (in 1,000). Statista. Statista Inc.. Accessed: May 23, 2024. https://www.statista.com/statistics/298045/business-meeting-volume-in-the-united-kingdom-by-city/
MPI Foundation. "Number of Meetings in The United Kingdom (Uk) in 2011, by City (in 1,000)." Statista, Statista Inc., 10 Jul 2013, https://www.statista.com/statistics/298045/business-meeting-volume-in-the-united-kingdom-by-city/
MPI Foundation, Number of meetings in the United Kingdom (UK) in 2011, by city (in 1,000) Statista, https://www.statista.com/statistics/298045/business-meeting-volume-in-the-united-kingdom-by-city/ (last visited May 23, 2024)
Number of meetings in the United Kingdom (UK) in 2011, by city (in 1,000) [Graph], MPI Foundation, July 10, 2013. [Online]. Available: https://www.statista.com/statistics/298045/business-meeting-volume-in-the-united-kingdom-by-city/