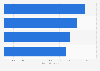
Bitte beachten Sie, dass die von Ihnen aufgerufene Seite nicht in Ihrer Standardsprache vorliegt. Sie nutzen unsere Plattform nun in einer anderen Sprache.
This statistic displays the annual net profits/losses of McLaren Automotive from 2012 to 2018. The British automobile carmaker had recorded a turbulent development in 2017 and 2018, with 2017 seeing the greatest net loss in this time period, followed by the greatest net profit in 2018.
Annual profit/loss for the year of McLaren Automotive from 2012 to 2018 (in million GBP)
Basic Account
Get to know the platform
You only have access to basic statistics.
This statistic is not included in your account.
Starter Account
The ideal entry-level account for individual users
- Instant access to 1m statistics
- Download in XLS, PDF & PNG format
- Detailed references
$199 USD / Month *
Professional Account
Full access
Business Solutions including all features.
* Prices do not include sales tax.
Other statistics that may interest you Bentley: a British luxury car brand
Overview
6
- Premium Statistic Bentley Motors: global production volume 2009-2023
- Basic Statistic Bentley: global vehicle deliveries 2013-2023
- Premium Statistic British luxury car brand Bentley: vehicle production growth 2009-2021
- Premium Statistic Bentley Motors: global vehicle sales growth 2009-2022
- Premium Statistic Bentley Motors: production 2015-2023, by model
- Basic Statistic Volkswagen Group: revenue by vehicle subsidiary 2015-2023
Financials
3
Competitors
5
Bentley in Britain
7
- Basic Statistic Bentley Continental cars registered in Great Britain 2004-2020
- Premium Statistic Bentley Mulsanne cars registered in Great Britain 2004-2018
- Basic Statistic Bentley Arnage cars registered in Great Britain 2004-2018
- Premium Statistic Bentley Brooklands cars registered in Great Britain 2004-2018
- Basic Statistic Bentley Turbo cars registered in Great Britain 2004-2020
- Premium Statistic Bentley Bentayga cars registered in Great Britain 2016-2018
- Premium Statistic Bentley Flying Spur cars registered in Great Britain 2013-2018
Further related statistics
8
- China: SAIC auto sales by type 2009-2021
- Employees of Banco Santander 2013-2023, by gender
- Profit development of Santander group 2001-2023
- Non-statutory profit and loss before impairment of the NatWest group 2015-2023
- ExxonMobil's Downstream net profit 2001-2021
- Children age 4 and younger killed in passenger vehicle crashes in the U.S. 2011
- Reasons for American teenagers to save money in 2011
- Where American teenagers get their money in 2011
Further Content: You might find this interesting as well
Statistics
- China: SAIC auto sales by type 2009-2021
- Employees of Banco Santander 2013-2023, by gender
- Profit development of Santander group 2001-2023
- Non-statutory profit and loss before impairment of the NatWest group 2015-2023
- ExxonMobil's Downstream net profit 2001-2021
- Children age 4 and younger killed in passenger vehicle crashes in the U.S. 2011
- Reasons for American teenagers to save money in 2011
- Where American teenagers get their money in 2011
Companies House. (May 24, 2019). Annual profit/loss for the year of McLaren Automotive from 2012 to 2018 (in million GBP) [Graph]. In Statista. Retrieved June 11, 2024, from https://www.statista.com/statistics/1012238/mclaren-automotive-net-profit/
Companies House. "Annual profit/loss for the year of McLaren Automotive from 2012 to 2018 (in million GBP)." Chart. May 24, 2019. Statista. Accessed June 11, 2024. https://www.statista.com/statistics/1012238/mclaren-automotive-net-profit/
Companies House. (2019). Annual profit/loss for the year of McLaren Automotive from 2012 to 2018 (in million GBP). Statista. Statista Inc.. Accessed: June 11, 2024. https://www.statista.com/statistics/1012238/mclaren-automotive-net-profit/
Companies House. "Annual Profit/Loss for The Year of Mclaren Automotive from 2012 to 2018 (in Million Gbp)." Statista, Statista Inc., 24 May 2019, https://www.statista.com/statistics/1012238/mclaren-automotive-net-profit/
Companies House, Annual profit/loss for the year of McLaren Automotive from 2012 to 2018 (in million GBP) Statista, https://www.statista.com/statistics/1012238/mclaren-automotive-net-profit/ (last visited June 11, 2024)
Annual profit/loss for the year of McLaren Automotive from 2012 to 2018 (in million GBP) [Graph], Companies House, May 24, 2019. [Online]. Available: https://www.statista.com/statistics/1012238/mclaren-automotive-net-profit/