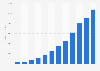
Bitte beachten Sie, dass die von Ihnen aufgerufene Seite nicht in Ihrer Standardsprache vorliegt. Sie nutzen unsere Plattform nun in einer anderen Sprache.
This statistic shows the revenue of the hardware industry from 2012 and 2018. In 2018, the revenue of the Singaporean hardware market reached around 181.6 billion Singapore dollars, indicating an increase of over 100 billion dollars compared to 2012.
Market value of the hardware industry in Singapore from 2012 to 2018 (in billion Singapore dollars)
Basic Account
Get to know the platform
You only have access to basic statistics.
This statistic is not included in your account.
Starter Account
The ideal entry-level account for individual users
- Instant access to 1m statistics
- Download in XLS, PDF & PNG format
- Detailed references
$199 USD / Month *
Professional Account
Full access
Business Solutions including all features.
* Prices do not include sales tax.
Other statistics that may interest you Statistics on
About the industry
10
- Premium Statistic Expenditure on hardware and software in businesses Australia 2015-2016, by state
- Basic Statistic KLA Tencor: revenue 2009-2012, by region
- Basic Statistic IBM global research, development, and engineering expenditure worldwide 2005-2023
- Premium Statistic Tokyo Electron's net sales FY 2014-2023
- Premium Statistic Tokyo Electron's net income FY 2014-2023
- Premium Statistic Tokyo Electron's sales FY 2023, by region
- Premium Statistic IBM cloud & cognitive software revenue worldwide 2018-2020, by subsegment
- Premium Statistic IBM systems revenue worldwide 2018-2020, by subsegment
- Basic Statistic IBM global technology and business services segment revenue 2008-2020
- Premium Statistic Global ICT revenue 2005-2019
About the region
10
- Premium Statistic Computer hardware software and peripherals production value in Singapore 2016-2018
- Premium Statistic Computer hardware software and peripherals export value in Singapore 2016-2018
- Premium Statistic Computer hardware, software, and peripherals import value in Singapore 2016-2018
- Premium Statistic Computer hardware software and peripherals market size in Singapore 2016-2018
- Basic Statistic Telecom services revenue in Singapore 2012-2018
- Premium Statistic Software revenue in Singapore 2013-2018
- Premium Statistic Infocomm re-export revenue breakdown in Singapore 2018 by sector
- Premium Statistic Infocomm processed export revenue breakdown in Singapore 2018 by sector
- Premium Statistic Domestic infocomm re-export revenue breakdown in Singapore 2018 by sector
- Premium Statistic IT services revenue in Singapore 2012-2018
Selected statistics
1
Other regions
10
- Premium Statistic Global government IT spending 2019-2023
- Premium Statistic Digital ICT market: revenue in Europe 2012-2019
- Basic Statistic Ranking: computer brand equity 2012
- Premium Statistic Server market share in Asia Pacific 2009-2011, by vendor
- Premium Statistic PC penetration in North America 2000-2015
- Basic Statistic PC penetration in Eastern Europe 2000-2015
- Basic Statistic PC penetration in the Middle East and Africa 2005-2015
- Premium Statistic London Stock Exchange (UK): computer and IT companies 2015-2016, by subsector
- Premium Statistic Companies in the software industry in China 2012-2022
- Basic Statistic Germany: manufacturers of computers & peripheral equipment 2013-2022
Related statistics
10
- Premium Statistic Infocomm revenue in Singapore 2012-2018
- Premium Statistic Infocomm revenue distribution in Singapore 2018 by segment
- Premium Statistic Domestic infocomm revenue in Singapore 2012-2018
- Premium Statistic Export infocomm revenue in Singapore 2012-2018
- Premium Statistic Infocommunication and media industry job vacancies in Singapore 2018 by sector
- Premium Statistic Infocommunication media industry employment in Singapore 2018 by sector
- Premium Statistic Infocommunication and media industry manpower demand in Singapore 2018 by sector
- Premium Statistic Distribution of infocommunication professionals Singapore 2018 by sector
- Premium Statistic Bachelor's degree holders in mass communication Singapore 2013-2022, by gender
- Premium Statistic Commerce and services-related energy consumption in Singapore 2012-2021
Further related statistics
10
- Global PC sales via direct salesforces 2010, by vendor
- NortonLifeLock: net revenue 2012-2023, by region
- Symantec: net revenue 2013-2017, by segment
- Printer cartridge: ASP worldwide 2007-2015
- Forecast: printer cartridge revenue in North America 2007-2015
- Consulting service providers: global revenue 2008-2009
- Net sales of GameStop worldwide 2010-2022, by region
- Revenue of Salesforce.com broken down 2009-2024, by segment
- Hebei Iron and Steel's (HBIS) gross profit in China 2012-2021
- Computer software: Online purchasing in Great Britain 2020, by age group
Further Content: You might find this interesting as well
Statistics
- Global PC sales via direct salesforces 2010, by vendor
- NortonLifeLock: net revenue 2012-2023, by region
- Symantec: net revenue 2013-2017, by segment
- Printer cartridge: ASP worldwide 2007-2015
- Forecast: printer cartridge revenue in North America 2007-2015
- Consulting service providers: global revenue 2008-2009
- Net sales of GameStop worldwide 2010-2022, by region
- Revenue of Salesforce.com broken down 2009-2024, by segment
- Hebei Iron and Steel's (HBIS) gross profit in China 2012-2021
- Computer software: Online purchasing in Great Britain 2020, by age group
IMDA. (February 10, 2020). Market value of the hardware industry in Singapore from 2012 to 2018 (in billion Singapore dollars) [Graph]. In Statista. Retrieved May 11, 2024, from https://www.statista.com/statistics/1004762/singapore-hardware-revenue/
IMDA. "Market value of the hardware industry in Singapore from 2012 to 2018 (in billion Singapore dollars)." Chart. February 10, 2020. Statista. Accessed May 11, 2024. https://www.statista.com/statistics/1004762/singapore-hardware-revenue/
IMDA. (2020). Market value of the hardware industry in Singapore from 2012 to 2018 (in billion Singapore dollars). Statista. Statista Inc.. Accessed: May 11, 2024. https://www.statista.com/statistics/1004762/singapore-hardware-revenue/
IMDA. "Market Value of The Hardware Industry in Singapore from 2012 to 2018 (in Billion Singapore Dollars)." Statista, Statista Inc., 10 Feb 2020, https://www.statista.com/statistics/1004762/singapore-hardware-revenue/
IMDA, Market value of the hardware industry in Singapore from 2012 to 2018 (in billion Singapore dollars) Statista, https://www.statista.com/statistics/1004762/singapore-hardware-revenue/ (last visited May 11, 2024)
Market value of the hardware industry in Singapore from 2012 to 2018 (in billion Singapore dollars) [Graph], IMDA, February 10, 2020. [Online]. Available: https://www.statista.com/statistics/1004762/singapore-hardware-revenue/