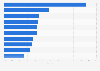
Bitte beachten Sie, dass die von Ihnen aufgerufene Seite nicht in Ihrer Standardsprache vorliegt. Sie nutzen unsere Plattform nun in einer anderen Sprache.
This statistic illustrates the share of sales made by business group within Valeo between 2014 and 2017. The share of Valeo's sales by business group remained mostly the same from 2014 through 2016. However, by 2017 the visibility systems sales share had increased, amounting to 31 percent.
Share of sales made by business group in Valeo from 2014 to 2017 (in million euros)
Basic Account
Get to know the platform
You only have access to basic statistics.
This statistic is not included in your account.
Starter Account
The ideal entry-level account for individual users
- Instant access to 1m statistics
- Download in XLS, PDF & PNG format
- Detailed references
$199 USD / Month *
Professional Account
Full access
Business Solutions including all features.
* Prices do not include sales tax.
Other statistics that may interest you Automotive industry worldwide
Overview
8
- Premium Statistic Revenue - automobile manufacturing industry worldwide 2019-2023
- Premium Statistic Automotive - global merger and acquisition deal value Q1 2017-Q1 2023
- Premium Statistic Automotive R&D spending worldwide 2020-2022
- Premium Statistic R&D expenses and intensity of selected automotive companies worldwide 2022
- Premium Statistic Value of automotive products imports in key countries worldwide 2022
- Premium Statistic Value of automotive products exports in key countries worldwide 2022
- Basic Statistic Best-selling car models worldwide in 2023
- Premium Statistic Best selling SUV models worldwide in 2023
Production
6
- Basic Statistic Worldwide motor vehicle production 2000-2023
- Premium Statistic Worldwide motor vehicle production growth 2015-2023
- Basic Statistic Worldwide motor vehicle production by type 2019-2023
- Premium Statistic Changes in worldwide vehicle production by region 2016-2023
- Basic Statistic Major passenger car producing countries 2023
- Premium Statistic Worldwide commercial vehicle production by region 2018-2022
Sales
8
- Premium Statistic Motor vehicle sales worldwide 2005-2022
- Basic Statistic Motor vehicle sales growth worldwide 2015-2022
- Premium Statistic Motor vehicle sales worldwide by type 2016-2022
- Premium Statistic Annual car sales worldwide 2010-2023, with a forecast for 2024
- Premium Statistic International automobile sales by region 2018-2024
- Premium Statistic Largest automobile markets based on new car registrations 2023
- Premium Statistic Commercial vehicles worldwide sales 2005-2022
- Premium Statistic Commercial vehicles - sales in selected countries 2022
Leading manufacturers
8
- Premium Statistic Revenue of leading carmakers worldwide 2022
- Premium Statistic Car brand market share worldwide 2023
- Premium Statistic Toyota Motor Corporation: net revenue 2012-2024
- Premium Statistic Toyota Motor Corporation: motor vehicle sales by region 2017-2024
- Basic Statistic Volkswagen Group's sales revenue 2006-2023
- Premium Statistic Volkswagen Group - worldwide vehicle deliveries 2012-2023
- Premium Statistic Honda's annual revenue 2002-2024
- Basic Statistic Honda's worldwide automobile sales 2002-2023
Leading suppliers
6
- Premium Statistic The leading global automotive suppliers based on revenue 2022
- Premium Statistic Bosch - revenue 2008-2023
- Basic Statistic Denso - global revenue 2008-2023
- Premium Statistic ZF Friedrichshafen AG sales revenue 2009-2023
- Premium Statistic Magna International Inc. - global sales 2011-2023
- Premium Statistic Aisin Corporation's revenue FY 2015-2024
Further related statistics
9
- China: SAIC auto sales by type 2009-2021
- Footwear retail sales volume trend in Great Britain (UK) 2008-2022
- Net sales of GameStop worldwide 2010-2023, by region
- Net sales of Dick's Sporting Goods U.S. 2006-2023
- Sales share of L'Oréal's global cosmetic branch 2023, by geographic zone
- The adidas Group's global footwear production from 2008-2023
- Operating income of Dine Brands Global worldwide 2008-2023
- Net income of Dine Brands Global worldwide 2008-2023
- Sales of International House of Pancakes (IHOP) restaurants in the U.S. 2009-2023
Further Content: You might find this interesting as well
Statistics
- China: SAIC auto sales by type 2009-2021
- Footwear retail sales volume trend in Great Britain (UK) 2008-2022
- Net sales of GameStop worldwide 2010-2023, by region
- Net sales of Dick's Sporting Goods U.S. 2006-2023
- Sales share of L'Oréal's global cosmetic branch 2023, by geographic zone
- The adidas Group's global footwear production from 2008-2023
- Operating income of Dine Brands Global worldwide 2008-2023
- Net income of Dine Brands Global worldwide 2008-2023
- Sales of International House of Pancakes (IHOP) restaurants in the U.S. 2009-2023
Valeo. (March 30, 2018). Share of sales made by business group in Valeo from 2014 to 2017 (in million euros) [Graph]. In Statista. Retrieved June 11, 2024, from https://www.statista.com/statistics/695472/valeo-sales-by-segment/
Valeo. "Share of sales made by business group in Valeo from 2014 to 2017 (in million euros)." Chart. March 30, 2018. Statista. Accessed June 11, 2024. https://www.statista.com/statistics/695472/valeo-sales-by-segment/
Valeo. (2018). Share of sales made by business group in Valeo from 2014 to 2017 (in million euros). Statista. Statista Inc.. Accessed: June 11, 2024. https://www.statista.com/statistics/695472/valeo-sales-by-segment/
Valeo. "Share of Sales Made by Business Group in Valeo from 2014 to 2017 (in Million Euros)." Statista, Statista Inc., 30 Mar 2018, https://www.statista.com/statistics/695472/valeo-sales-by-segment/
Valeo, Share of sales made by business group in Valeo from 2014 to 2017 (in million euros) Statista, https://www.statista.com/statistics/695472/valeo-sales-by-segment/ (last visited June 11, 2024)
Share of sales made by business group in Valeo from 2014 to 2017 (in million euros) [Graph], Valeo, March 30, 2018. [Online]. Available: https://www.statista.com/statistics/695472/valeo-sales-by-segment/