Bitte beachten Sie, dass die von Ihnen aufgerufene Seite nicht in Ihrer Standardsprache vorliegt. Sie nutzen unsere Plattform nun in einer anderen Sprache.
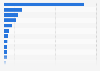
This statistic shows the share of respondents listening to the radio via the internet in Greenland in 2018, by frequency. The graph shows that 82 percent never listened to the radio via the internet. In contrast, only two percent listened to the radio via the internet almost daily.
Share of respondents listening to the radio via the internet in Greenland in 2018, by frequency
Basic Account
Get to know the platform
You only have access to basic statistics.
This statistic is not included in your account.
Starter Account
The ideal entry-level account for individual users
- Instant access to 1m statistics
- Download in XLS, PDF & PNG format
- Detailed references
$199 USD / Month *
Professional Account
Full access
Business Solutions including all features.
* Prices do not include sales tax.
Other statistics that may interest you Statistics on
About the industry
10
- Premium Statistic African American internet activities while listening to internet radio in 2012
- Premium Statistic Usage of audio files on the internet in Germany 2019-2022
- Premium Statistic Frequency of listening to radio stations on the internet in Sweden 2020
- Basic Statistic Share of the population who listen to online music in Belgium 2012-2019
- Premium Statistic Frequency of listening to radio stations on the internet in Sweden 2019, by gender
- Premium Statistic Listening to radio using selected platforms in Sweden 2018, by frequency
- Premium Statistic Share of online users, who listen to internet radio occasionally, Germany 2003-2023
- Premium Statistic Individuals who listened to online radio daily in Norway 2021, by age
- Premium Statistic Average web radio reach per day in Sweden 2019, by age group
- Premium Statistic Leading radio stations in Germany 2023, by gross contacts
About the region
5
- Premium Statistic Greenland: digital population 2024
- Premium Statistic Listening to FM radio in Greenland 2018, by frequency
- Premium Statistic Airtime of KNR radio productions 2019, by genre
- Premium Statistic Net revenue of KNR 2013-2019
- Premium Statistic Time spent listening to the radio in Greenland 2017-2018, by type
Other regions
10
- Basic Statistic Leading online activities ever carried out in the United Kingdom (UK) 2023
- Premium Statistic Regular leisure activities of children in Germany 2018
- Premium Statistic Average internet map and locator page view duration in Poland 2019, by age group
- Premium Statistic Distribution of time spent listening to the radio in Denmark 2019, by platform
- Premium Statistic Media penetration in Indonesia 2014
- Premium Statistic Italy: children recreation activities preferences 2015
- Premium Statistic Number of Sirius XM Canada's subscribers 2012-2017
- Basic Statistic Internet banking in the Benelux region 2005-2017
- Basic Statistic Time spent by young adults on the Internet for leisure in France 2018, by device used
- Basic Statistic Digital media purchasing penetration in Great Britain 2020, by gender
Related statistics
10
- Premium Statistic Share of weekly online radio listeners in the U.S. 2000-2023
- Premium Statistic Share of monthly online radio listeners in the U.S. 2007-2023
- Premium Statistic Mobile radio penetration in the United Kingdom (UK) Q2 2010 -Q1 2020
- Premium Statistic Weekly online radio consumption in selected countries worldwide in 2013
- Premium Statistic Number of Sirius XM subscribers in the U.S. 2011-2023
- Basic Statistic Sirius XM Holdings' quarterly revenue Q1 2011 - Q3 2023
- Premium Statistic Share of U.S. consumers who listen to audio podcasts 2006-2022
- Premium Statistic Time spent listening to digital radio in the United Kingdom (UK) Q1 2009-Q3 2023
- Premium Statistic Digital radio share of listening time in the United Kingdom (UK) Q1 2009-Q1 2023
- Premium Statistic Listening to online radio stations weekly in the United Kingdom (UK) 2014-2020
Further related statistics
10
- Households with internet access in GB from 2014 to 2020, by household composition
- Mobile internet use via laptops in Great Britain 2019, by demographic
- Internet usage on a mobile phone in Great Britain 2010-2019, by age
- Social network profile creation in the UK 2010-2020, by socio-economic group
- E-mail messaging penetration in Great Britain 2007-2020
- Daily internet use penetration in Great Britain 2006-2020
- Consumer electronics: Online purchasing in Great Britain 2020, by demographic
- Hours of internet use per week in the United Kingdom (UK) 2005-2019, by location
- User numbers of microblogs in China 2010-2018
- Media influencing final decisions about politics in the U.S. in 2011
Further Content: You might find this interesting as well
Statistics
- Households with internet access in GB from 2014 to 2020, by household composition
- Mobile internet use via laptops in Great Britain 2019, by demographic
- Internet usage on a mobile phone in Great Britain 2010-2019, by age
- Social network profile creation in the UK 2010-2020, by socio-economic group
- E-mail messaging penetration in Great Britain 2007-2020
- Daily internet use penetration in Great Britain 2006-2020
- Consumer electronics: Online purchasing in Great Britain 2020, by demographic
- Hours of internet use per week in the United Kingdom (UK) 2005-2019, by location
- User numbers of microblogs in China 2010-2018
- Media influencing final decisions about politics in the U.S. in 2011
Kalaallit Nunaata Radioa. (January 1, 2019). Share of respondents listening to the radio via the internet in Greenland in 2018, by frequency [Graph]. In Statista. Retrieved June 01, 2024, from https://www.statista.com/statistics/1023951/listening-to-the-radio-via-the-internet-in-greenland-by-frequency/
Kalaallit Nunaata Radioa. "Share of respondents listening to the radio via the internet in Greenland in 2018, by frequency." Chart. January 1, 2019. Statista. Accessed June 01, 2024. https://www.statista.com/statistics/1023951/listening-to-the-radio-via-the-internet-in-greenland-by-frequency/
Kalaallit Nunaata Radioa. (2019). Share of respondents listening to the radio via the internet in Greenland in 2018, by frequency. Statista. Statista Inc.. Accessed: June 01, 2024. https://www.statista.com/statistics/1023951/listening-to-the-radio-via-the-internet-in-greenland-by-frequency/
Kalaallit Nunaata Radioa. "Share of Respondents Listening to The Radio via The Internet in Greenland in 2018, by Frequency." Statista, Statista Inc., 1 Jan 2019, https://www.statista.com/statistics/1023951/listening-to-the-radio-via-the-internet-in-greenland-by-frequency/
Kalaallit Nunaata Radioa, Share of respondents listening to the radio via the internet in Greenland in 2018, by frequency Statista, https://www.statista.com/statistics/1023951/listening-to-the-radio-via-the-internet-in-greenland-by-frequency/ (last visited June 01, 2024)
Share of respondents listening to the radio via the internet in Greenland in 2018, by frequency [Graph], Kalaallit Nunaata Radioa, January 1, 2019. [Online]. Available: https://www.statista.com/statistics/1023951/listening-to-the-radio-via-the-internet-in-greenland-by-frequency/